Spend mapping · UNDP · 2011 to 2021
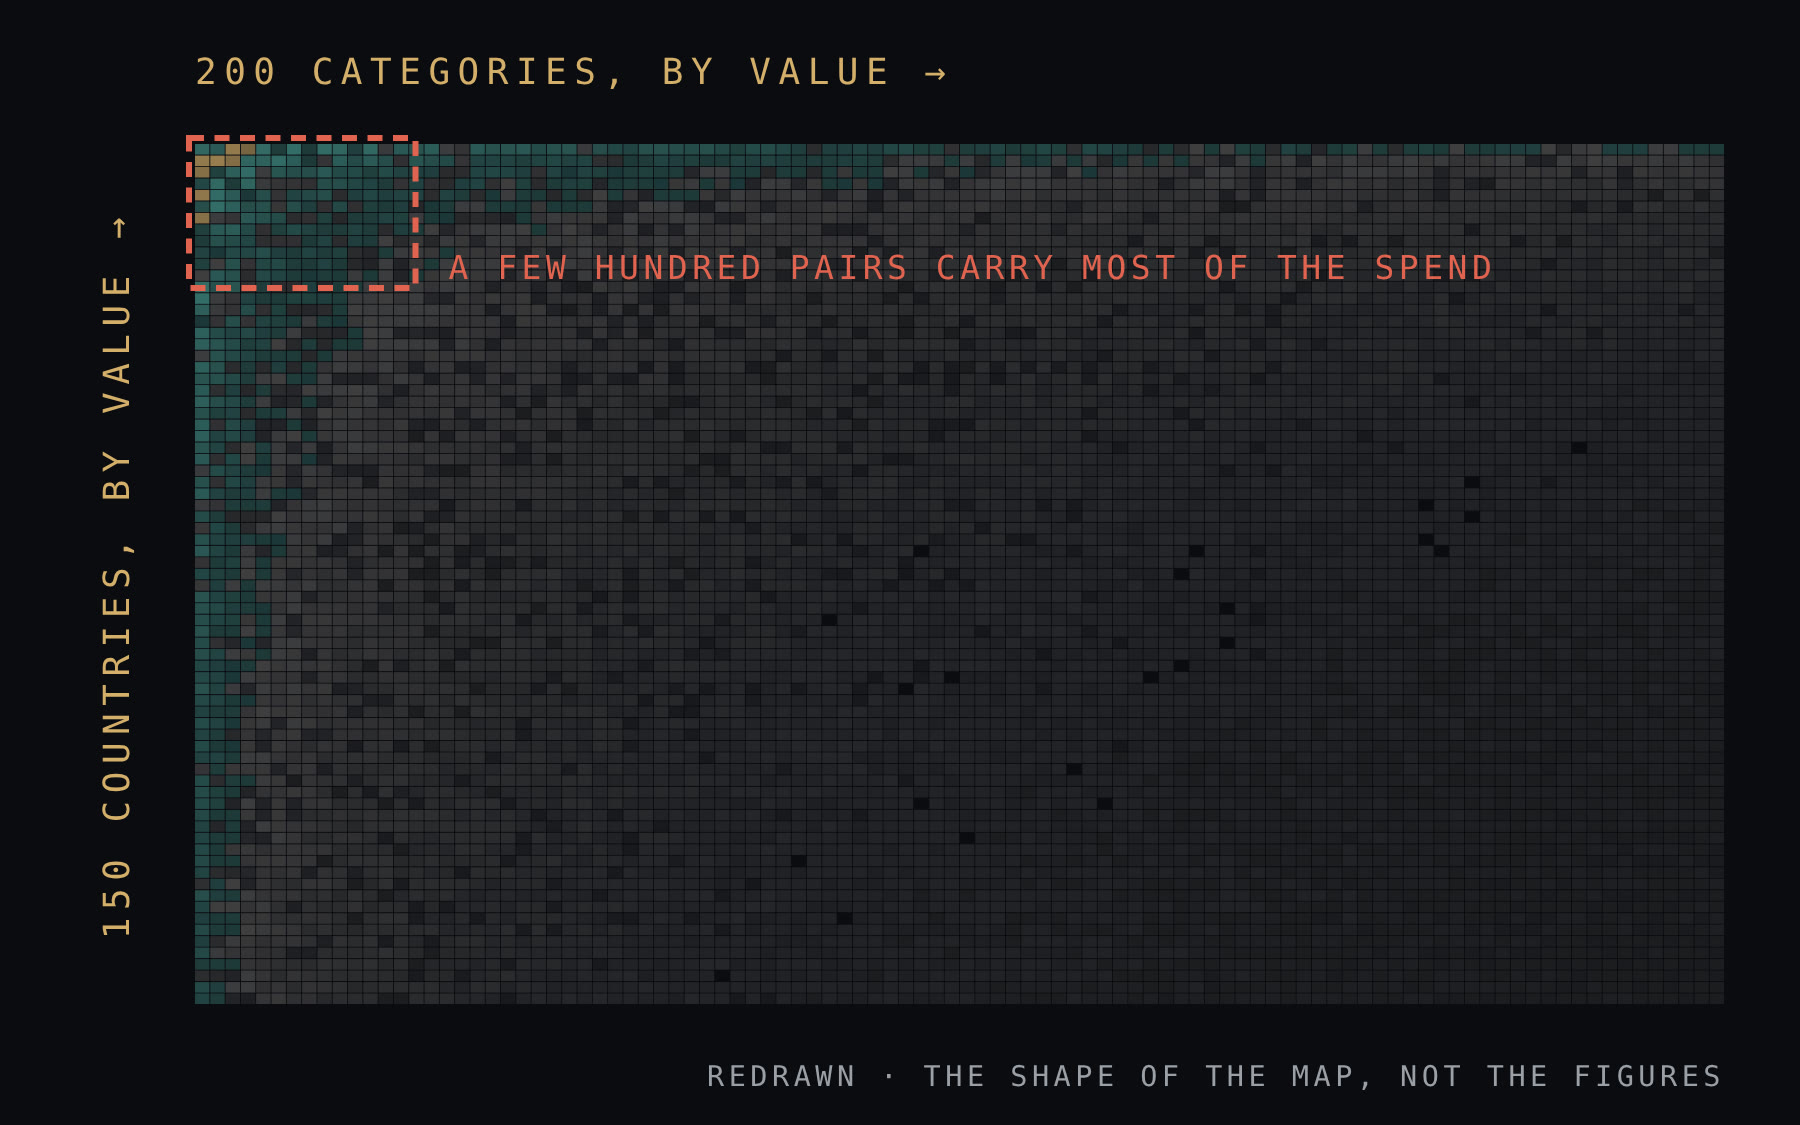
One heatmap, 150 countries by 200 categories.
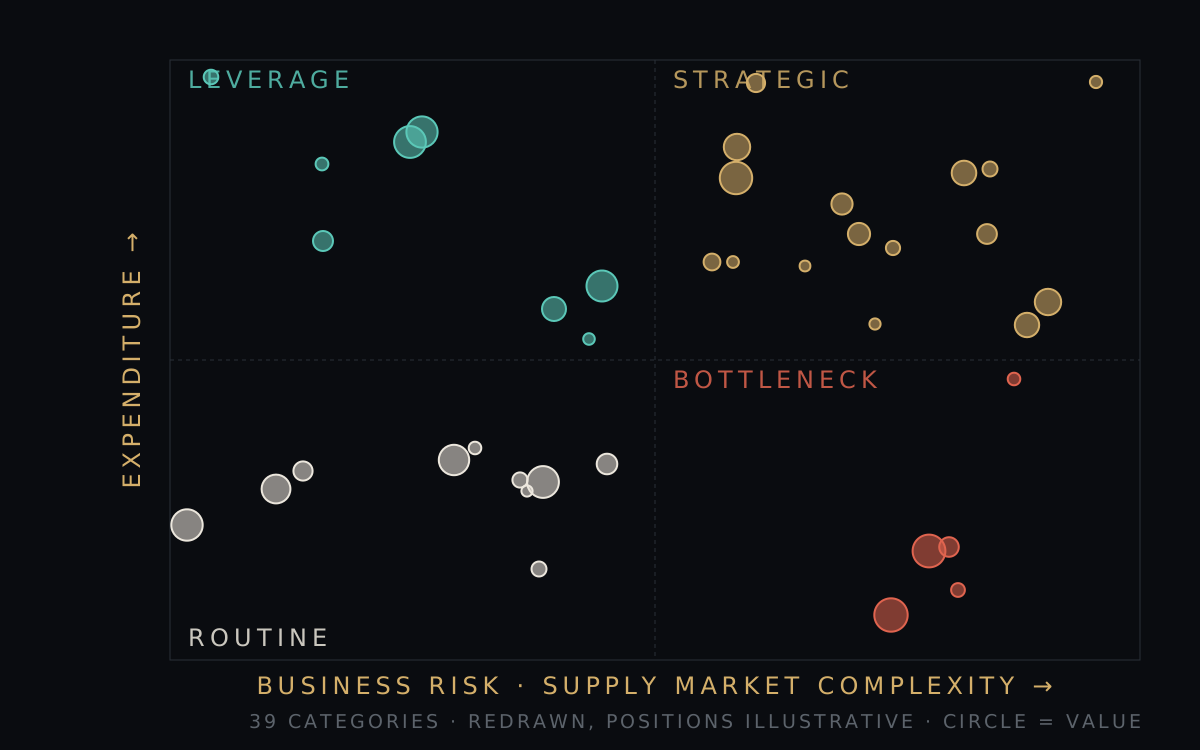
Every year, about 500,000 purchase-order rows of sixty fields each (some 30 million cells) were cleaned, reconstructed and summarised into 30,000 cells on a single map. Sorting by value concentration showed that a small fraction of country-category pairs carried nearly all institutional spend.
What it helped decide Where procurement strategy should concentrate, and which offices needed support first. The office clustering later fed the agency's 2018 business case for global shared services.
USD 11Ma year in savings potential, identified by the 2017 clustering model
My contribution Designed and ran the method, the models, the reports and the training. The USD 11M is the model's 2017 estimate, not an audited total.
Professional experience · first-handBenefit quantification deck, 2017, available for discussion where permitted